

Live Webcams | Current Weather + Forecasts | Weather by months | Hurricane Info
- CSL’s weather is similar to Palm Springs CA. Days are hot, sunny and the humidity is low.
- Average annual rainfall: 10 inches
- Coldest months: December and January (Max/min: 80/65ºF)
- Storm season: July to October
- Average Yearly Temperature: 78ºF
- Average water temperature (Sea of Cortez): 72ºF. Summer months: water temperature can reach the mid-80’s
- Pacific Ocean side weather of Los Cabos is generally 10-15ºF cooler than the Sea of Cortez coast.
Imagine the first day of summer – where it is perfectly warm – where it is not sweltering hot, and just warm enough that you don’t really feel the air. Imagine sweating Coronas and perfect popsicle weather.
In Cabo San Lucas & all of Los Cabos, it feels like “the beginning of summer” almost all year round. The local vibe matches the weather as well.
Current and forecasted conditions can be viewed below to plan your day of diving, snorkeling, boating, golf, parasailing, skydiving, surfing, or just lounging poolside or at the beach.
Live Webcams
Check out these webcams, for a live view of the current weather in Los Cabos.
Other options: Sunset de Mona Lisa in the Corridor and San Jose del Cabo. More webcams, click here.
Current Weather & Forecasts
Additional forecast sources can be found at Cabo weather forecast
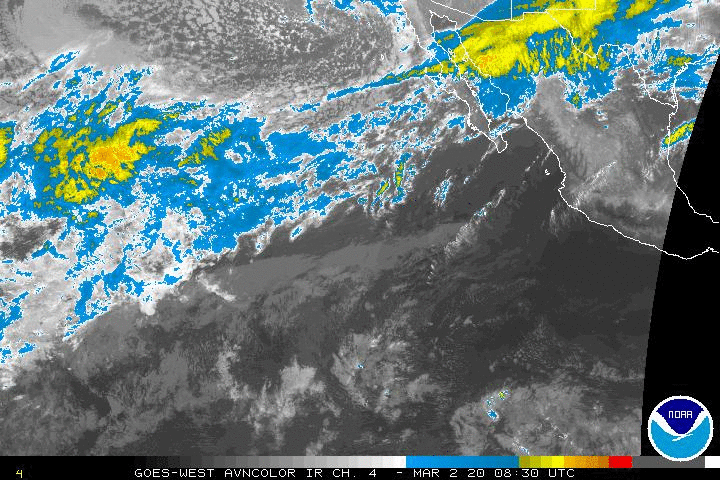
Live Weather Satellite Imagery
Winds
Current and forecasted future wind conditions in the Los Cabos area can be viewed here.
Tide, Sea and Surf
Cabo Weather by Month
|
Temperatures & Humidity (Cabo San Lucas) |
|||||
|
High |
Low |
Humidity |
|||
|
Celsius |
Fahrenheit |
Celsius |
Fahrenheit |
% |
|
|
January |
22 – 26 |
72 – 79 |
16 – 18 |
60 – 65 |
68 |
|
February |
22 – 24 |
72 – 75 |
16 – 18 |
60 – 65 |
65 |
|
March |
23 – 25 |
74 – 77 |
16 – 18 |
60 – 65 |
62 |
|
April |
26 – 29 |
79 – 84 |
18 – 21 |
63 – 67 |
60 |
|
May |
27 – 29 |
80 – 85 |
18 – 21 |
65 – 70 |
61 |
|
June |
27 – 29 |
80 – 85 |
19 – 22 |
67 – 72 |
65 |
|
July |
31 – 33 |
87 – 92 |
23 – 26 |
73 – 79 |
68 |
|
August |
32 – 35 |
90 – 95 |
23 – 27 |
74 – 80 |
70 |
|
September |
32 – 35 |
90 – 95 |
24 – 29 |
76 – 80 |
69 |
|
October |
29 – 33 |
85 – 91 |
23 – 26 |
74 – 79 |
71 |
|
November |
27 – 29 |
80 – 85 |
18 – 21 |
65 – 70 |
67 |
|
December |
23 – 27 |
73 – 80 |
18 – 21 |
65 – 70 |
66 |
Cabo San Lucas is located on the Tropic of Cancer.
- The average high in Cabo ranges from 78 to 93 °F (25 – 34 °C)
- Average low ranges from 55 to 65 °F (13 – 18 °C).
- The relative humidity typically ranges between 55 and 70%.
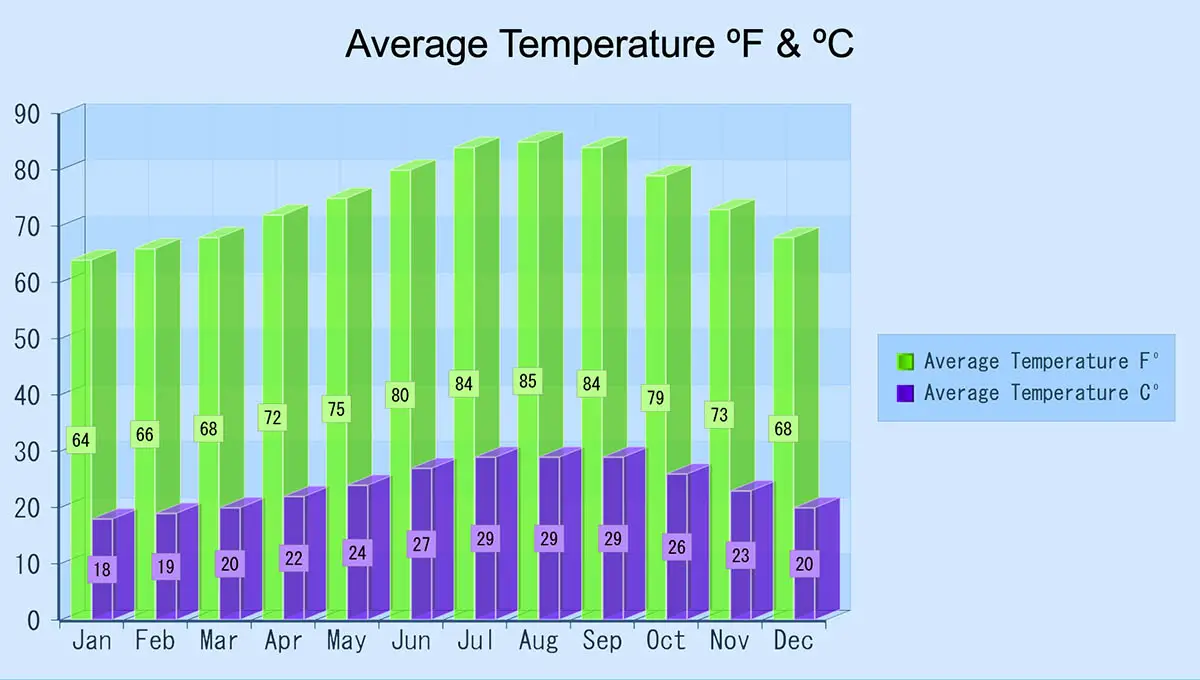
Average temperatures ºF and ºC (click image to enlarge)
The Los Cabos area is flanked on the west side by the Pacific Ocean and on the east side by the Sea of Cortez (Gulf of California), with the Sierra de La Laguna range cutting through the center of the Cape Region at the end of the Baja peninsula. This produces microclimates on either side of this peninsula, so temperatures on the Sea of Cortez side and Pacific Ocean side can vary as much as 15 °F.
During the summer months, the Sea of Cortez climate is more humid and hotter than the Pacific side; in the winter months, the Pacific side is considerably cooler than the Sea of Cortez. As a result, San José del Cabo and the East Cape have warmer summers, while Cabo San Lucas has cooler and windier winter weather.
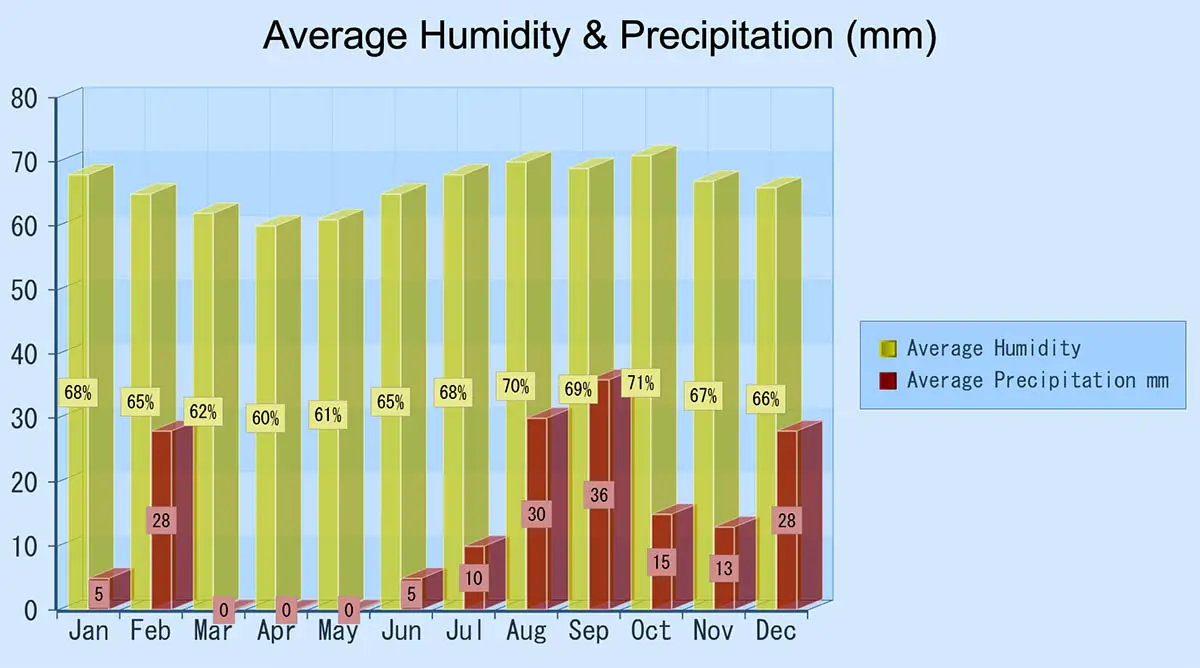
Average humidity & precipitation in millimeters (click image to enlarge)
The Los Cabos area is surrounded by desert plains so it receives very little rain and lots of sunshine. The climate is arid with over 300 days of sunshine, with some weather reports of over 350 days. The average annual rainfall is 10 inches (25.4cm), with more rain occurring during the month of September than the other months.

Sea temperatures range from a low of 70 – 72 °F (21 – 22 °C) in the winter, to a high of 82 – 84 °F (28 – 29 °C) in the summer. Expect water temperatures on the Pacific side of Cabo San Lucas to be between 5 °F and 10 °F lower (2.7 to 5.5 °C) compared to the Sea of Cortez. Dive conditions range from 20 feet to 90 feet visibility, depending upon the location and season.
Weather November through April (High Season)
Winter temperatures range from 70 °F in the daytime to the low sixties °F at night. The coolest month is typically February. During the winter, there historically has been a 2% average chance of precipitation at some point during a given day. Precipitation is most often in the form of light rain, with occasional moderate rain events.
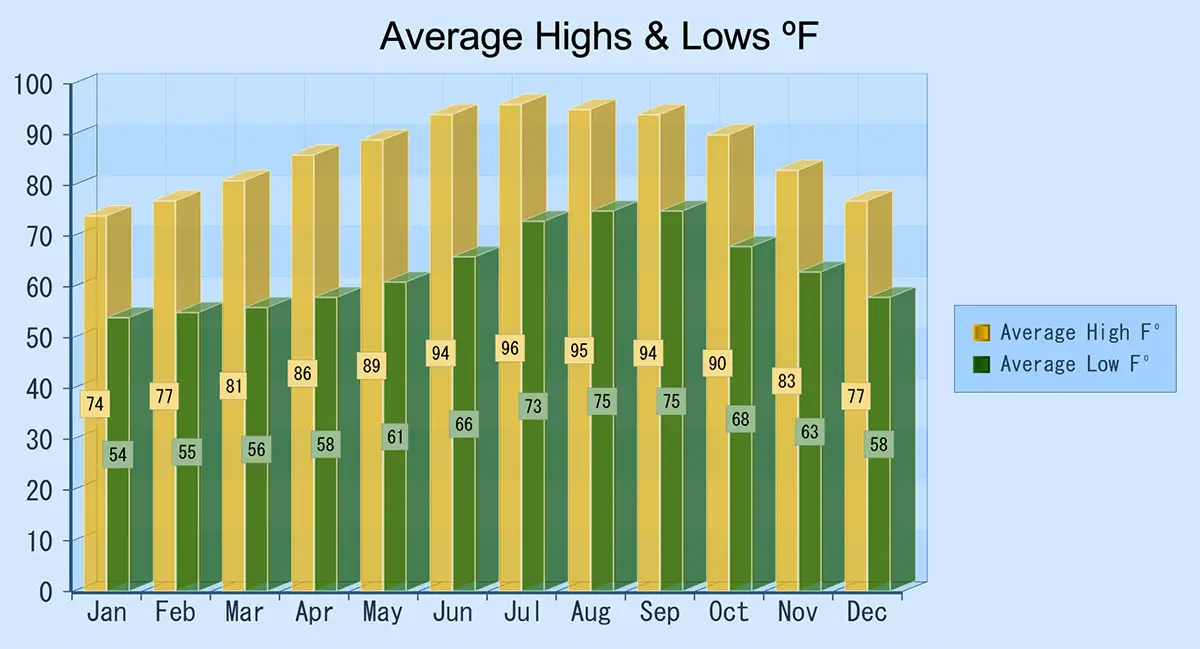
Average High & Low temps in Fahrenheit (click image to enlarge)
Weather from May through October
The warm season lasts from May through October, where July and August are typically the warmer months. Daytime temperatures are in the high 90 °F’s, cooling to 75 – 80 °F during the night. September historically is the wettest month relative to the other months.
During the warm season, there historically has been an 8% average chance of precipitation at some point during a given day. Precipitation is most often in the form of moderate to light rain with an occasional thunderstorm.
Hurricane Information
Hurricanes and tropical storms can come through the Los Cabos area. The hurricane season in the Eastern Pacific Ocean officially runs from May 15 to November 30, according to the National Oceanic and Atmospheric Administration (NOAA), however, most hurricanes develop later in the season due to the higher sea surface temperatures.
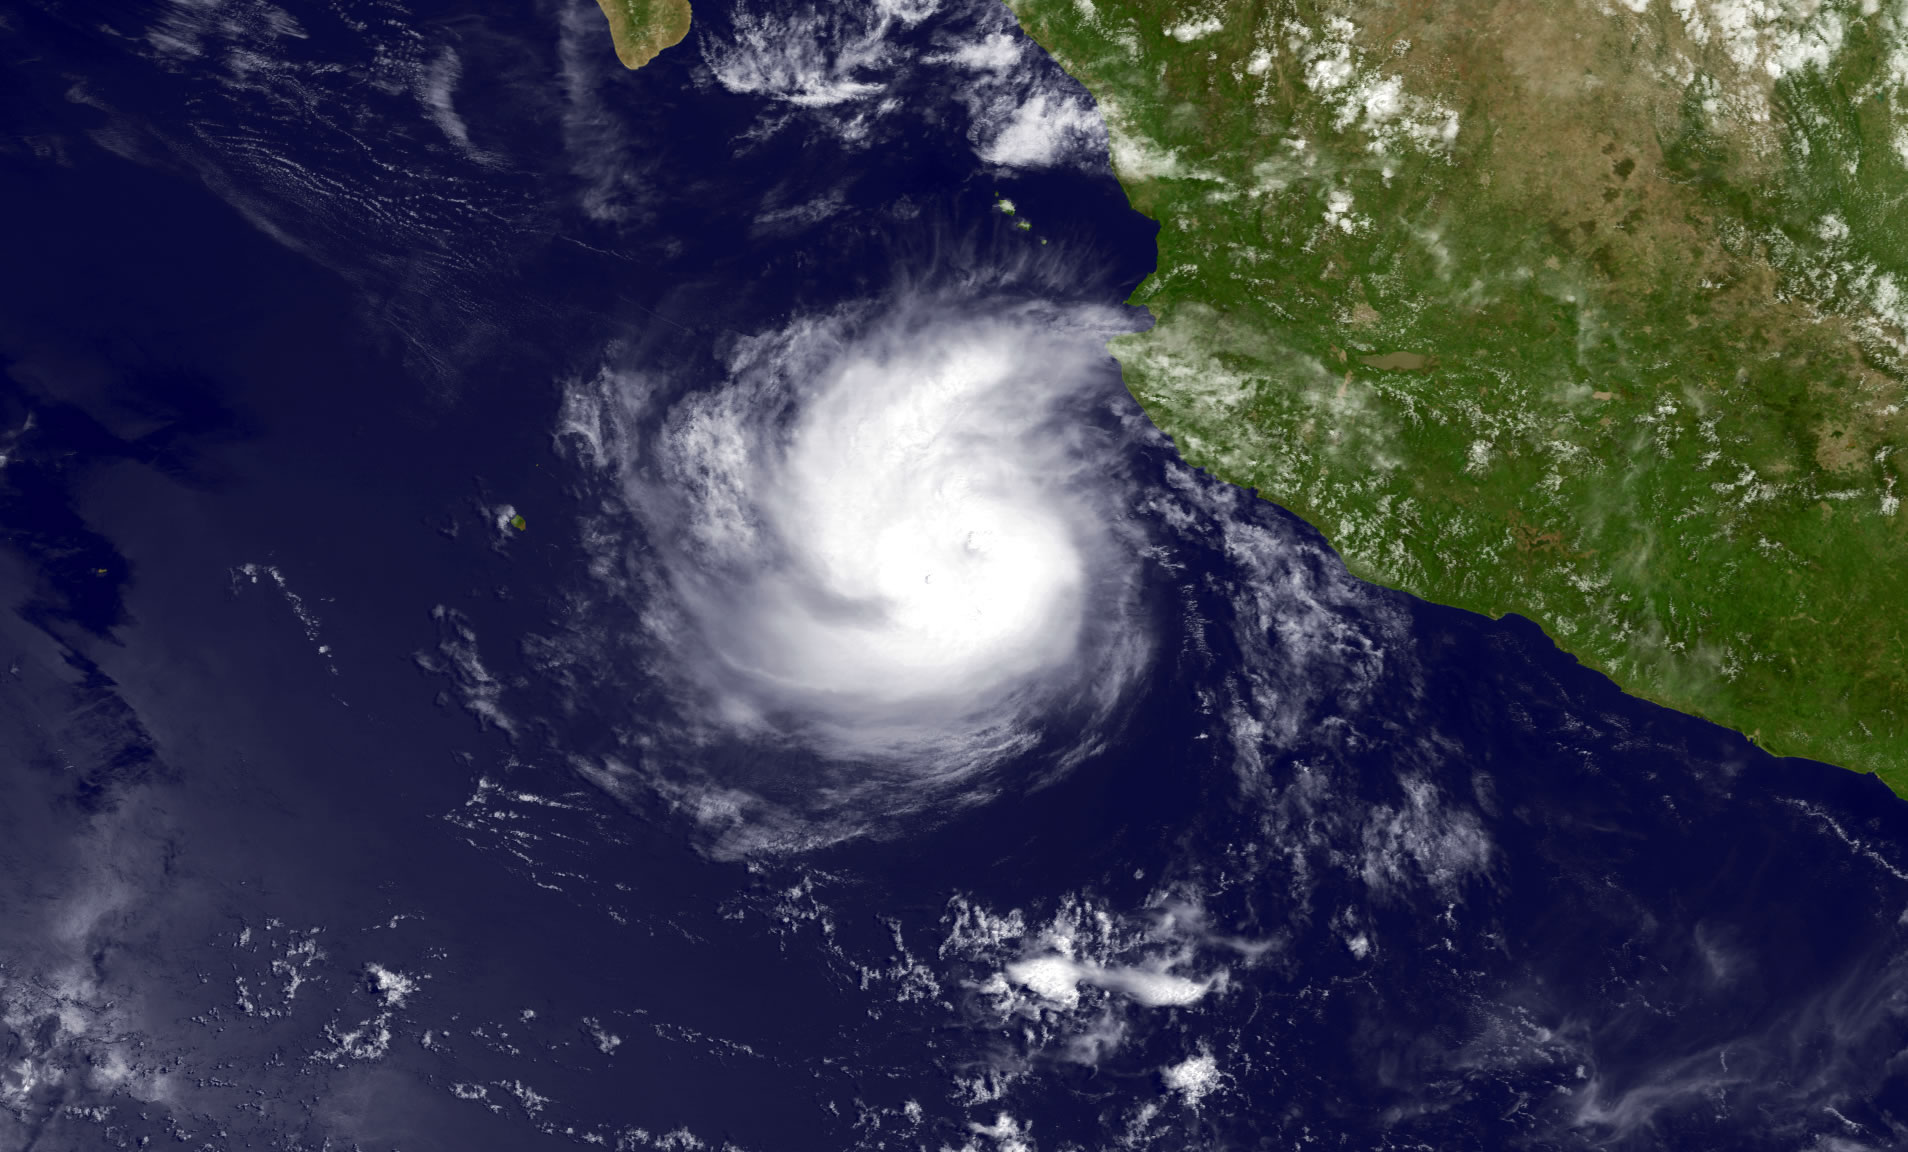
NOAA constantly monitors for hurricanes and tropical storms in the Eastern Pacific and uses forecast models to determine the likely trajectory and strength of the storms. This information is reported out in public advisories every few hours on the National Hurricane Center’s website.
The United States Air Force also sends reconnaissance aircraft over potential hurricanes to collect additional data, which is also reported in the public advisories. This allows for an adequate warning, usually on the order of many days, for the approach of a storm or hurricane.
Most businesses in Cabo just play through during a storm or even a hurricane, remaining open either through or right up until the storm and reopening right after.
The latest National Hurricane Center forecast for the Eastern Pacific here.